Research Areas
New Research
Tax Compliance
Covid Policy
Income Inequality
Tax Progressivity
Income Mobility
Tax Credits/Policy
Health/Pensions
Curriculum Vitae
Google Scholar

Comment on "How Much Tax Do Billionaires Pay?"
Summary: The U.S. tax system is highly progressive. Effective tax rates increase from 2% for the bottom quintile of income to 45% for the top hundredth of one percent. But rates may be lower among those with the highest wealth. This comment starts with the "top 400" tax rate estimates by wealth in Balkir, Saez, Yagan, and Zucman (2025, BSYZ), and adjusts these to account for Forbes family wealth being spread across multiple tax returns, to avoid double-counting capital income, to include missing taxes, and to apply standard tax and income definitions. This results in "top 400" effective tax rates exceeding overall tax rates by 13 percentage points. Still, the "top 400" tax rate is lower than for the top hundredth of one percent, suggesting a modest decline in effective tax rates at the very top when ranking by wealth. However, this is an unsurprising deviation from progressive rates because the tax system targets income, not wealth. Compared to the annual estimates in BSYZ, longer-run estimates are more appropriate for top wealth groups, which have volatile wealth and concentrate charitable giving into end-of-life bequests. End-of-life giving suggests long-run top 400 effective tax-and-giving rates could exceed 70%.
I. Introduction
Effective tax rate estimates are sensitive to researchers' assumptions, especially when considering those with high incomes or wealth. This comment raises concerns with the estimates of effective tax rates for the "top 400" U.S. tax units ranked by wealth in Balkir, Saez, Yagan, and Zucman (2025, BSYZ). The BSYZ estimates rely on ambitious data matching and provide important insights regarding corporate taxes and high-wealth charitable contributions. I modify those estimates to account for Forbes families showing up on multiple tax returns, to avoid double-counting capital income, to account for missing taxes, and to apply standard tax and income definitions. Instead of top 400 (i.e., top 0.0002% tax units) effective rates being below overall rates, as suggested by the BSYZ approach, the baseline extensions result in effective tax rates of the top 400 exceeding overall tax rates by about 13 percentage points. When considering annual charitable contributions, top 400 tax-and-giving rates increase to 59%. When also including end-of-life giving, top 400 tax-and-giving rates could reach 73%.
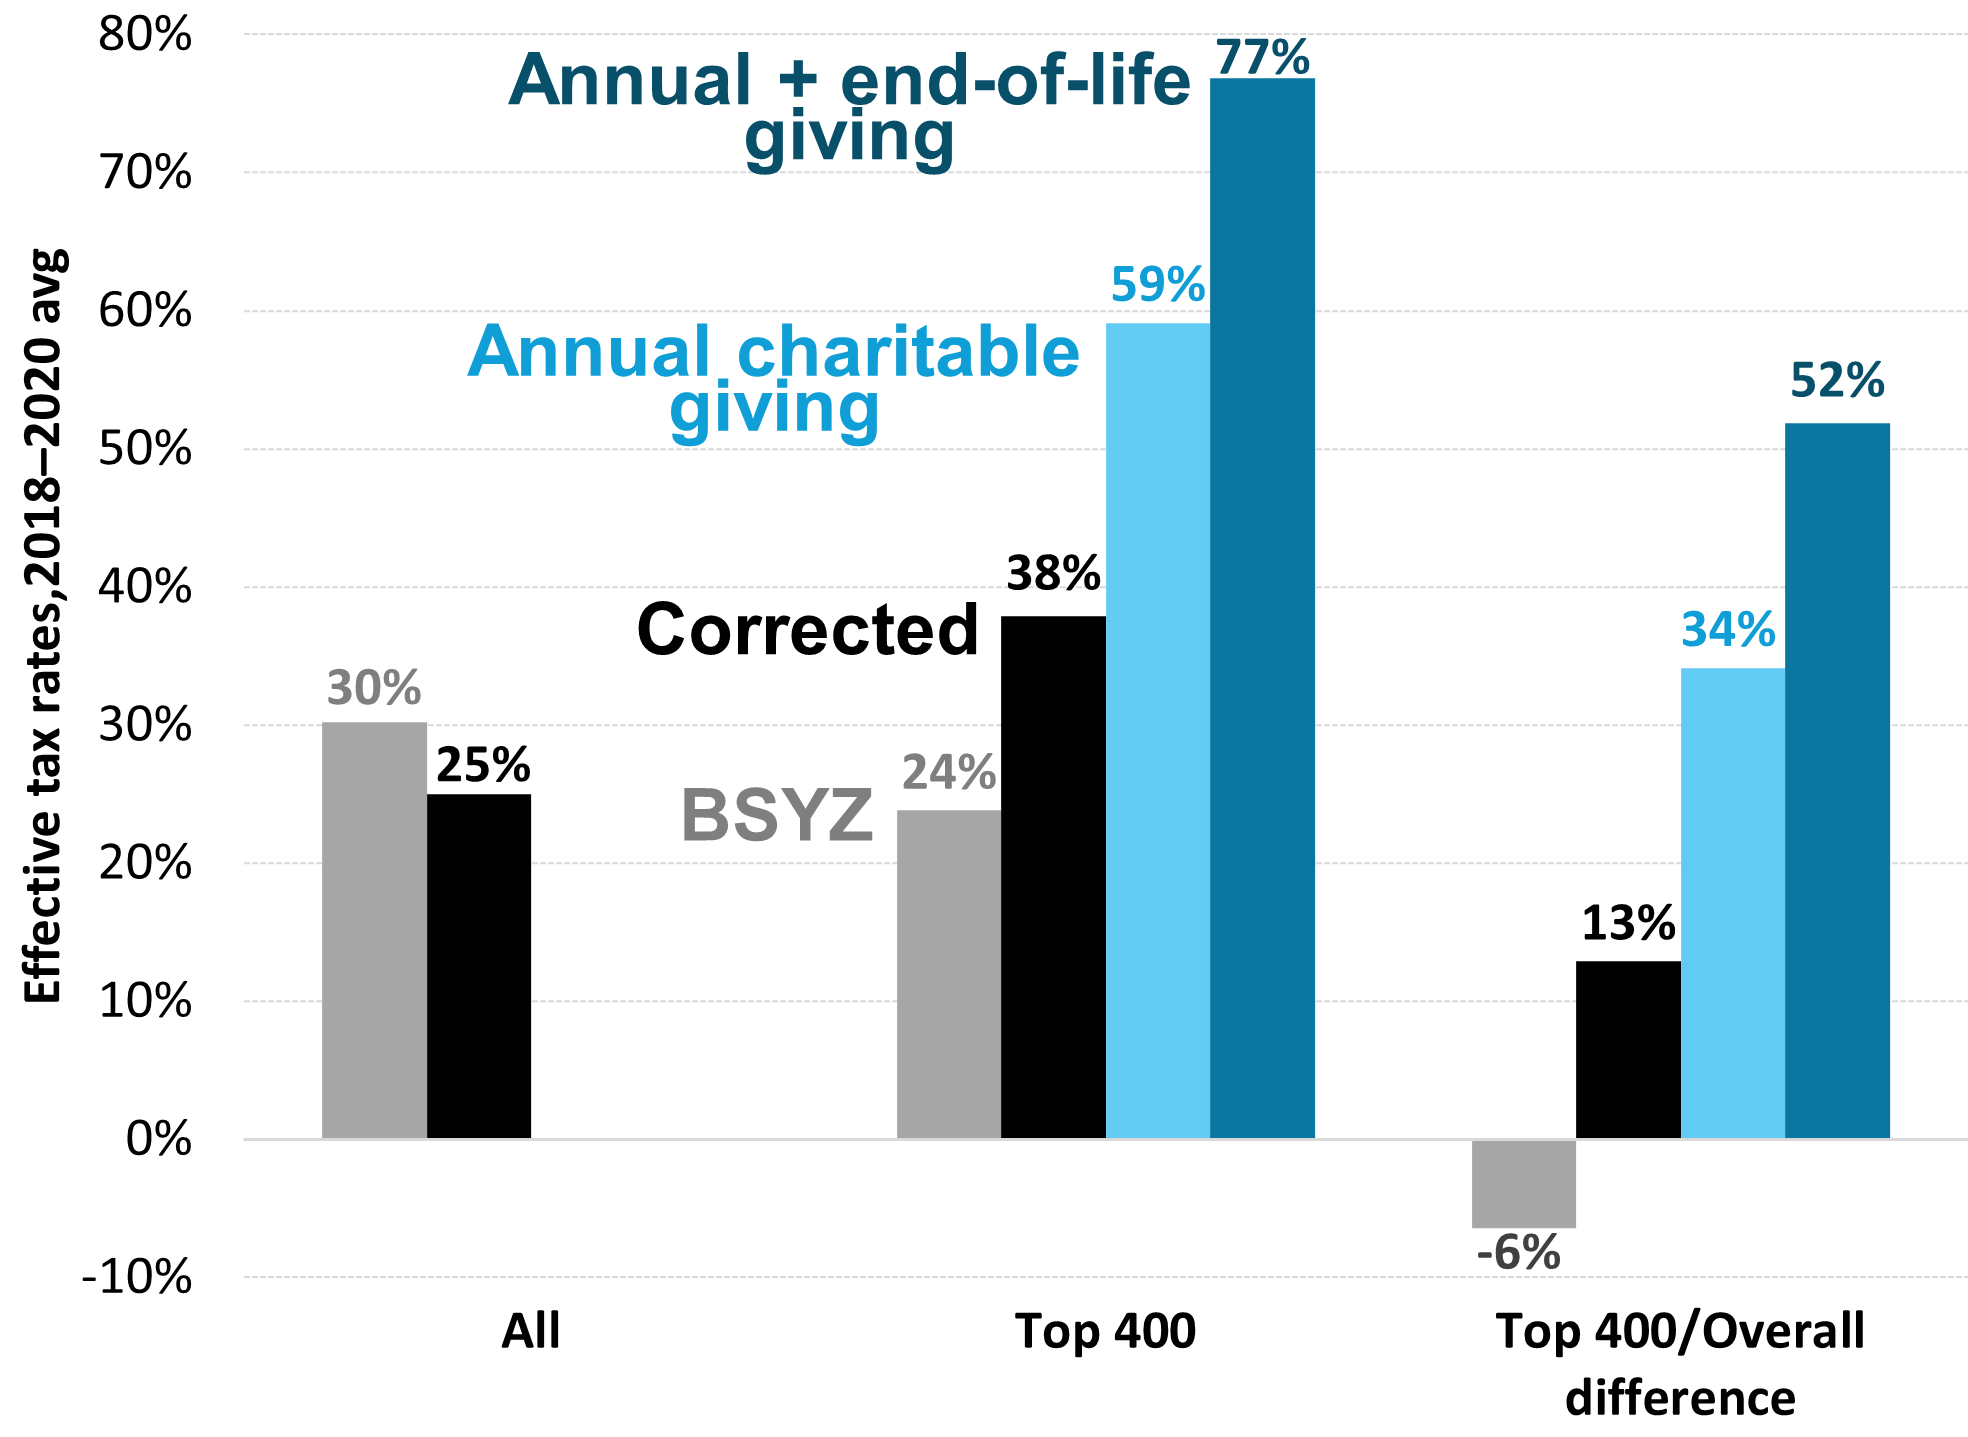
Figure 1: Effective tax-and-giving rates of "top 400" tax returns, 2018-2020 averages
This comment starts with the BSYZ baseline estimates for economic income, shown in gray in Figure 1. Accounting for refundable tax credits in taxes and transfers in income lowers overall tax rates from 30% to 25%, a 5 percentage point decrease. Three adjustments increase top 400 tax rates by removing double-counted capital income, assigning Forbes dynastic family wealth across multiple tax returns, and adding missing state income taxes. Using baseline assumptions, these adjustments increase top 400 tax rates from 24% to 38%, a 14 percentage point increase. The baseline assumptions result in the top 400 exceeding overall tax rates by about 13 percentage points. There is significant uncertainty in this estimate. Alternative assumptions for dynastic families suggest top 400 effective tax rates exceed overall tax rates by 9 to 19 percentage points (see appendix). Adding charitable contributions results in much higher top 400 tax-and-giving rates (light and dark blue). Annual contributions result in a top tax-and-giving rate of 59% and, while also subject to significant uncertainty, adding estimated end-of-life giving increases it to 73%. Step-by-step adjustments are shown in Table 1 and discussed below.
Figure 2: Effective U.S. Tax Rates by Income Group, 2018-2020 Notes: These are adjustments to BSYZ estimates, where "top 400" is the top 0.0002% of tax units. Forbes dynastic family adjustment: the assumed share of Forbes wealth to top tax returns (see appendix) is twice the BSYZ finding that only 30% of Forbes wealth appeared up on estate returns among Forbes 400 individuals who died in the sample. SALT cap correction assumes state income taxes increased proportionally with ordinary taxable income. Annual charitable giving is from BSYZ estimated 11.4% of economic income. End-of-life giving is based on the Joulfaian (2001) estimate that 47% of estate tax wealth is bequeathed (mostly to foundations), converted to a share of annual economic income using the BSYZ average income/wealth ratio, annualized by dividing by 30 years, and cut in half to account for missing wealth from estate tax returns among corrected Forbes individuals. Sources: Author's calculations using BEA national accounts data; Smith, Zidar, and Zwick (2023); and BSYZ.
1. Remove "pure" capital gains. National income includes dividends and other business profits. The Canberra group (2001, p. 29) expert report on national income cautioned that adding capital gains represents double counting: "If the value of a share increases because of the increased performance of the company concerned, the increase in the share will be related to the increase in dividends expected in the coming years. To count both as income would be to count the same income flow in two periods." Therefore, the "pure" capital gains added by BSYZ to national income results in double-counting due to including current capital gains as well as the associated profits. BSYZ do not break out "pure" capital gains, but it is about three-quarters of the other income (which also includes wages and carried interest). I reduce the top 400 income by this amount, which increases the top effective tax rate by 3 percentage points.
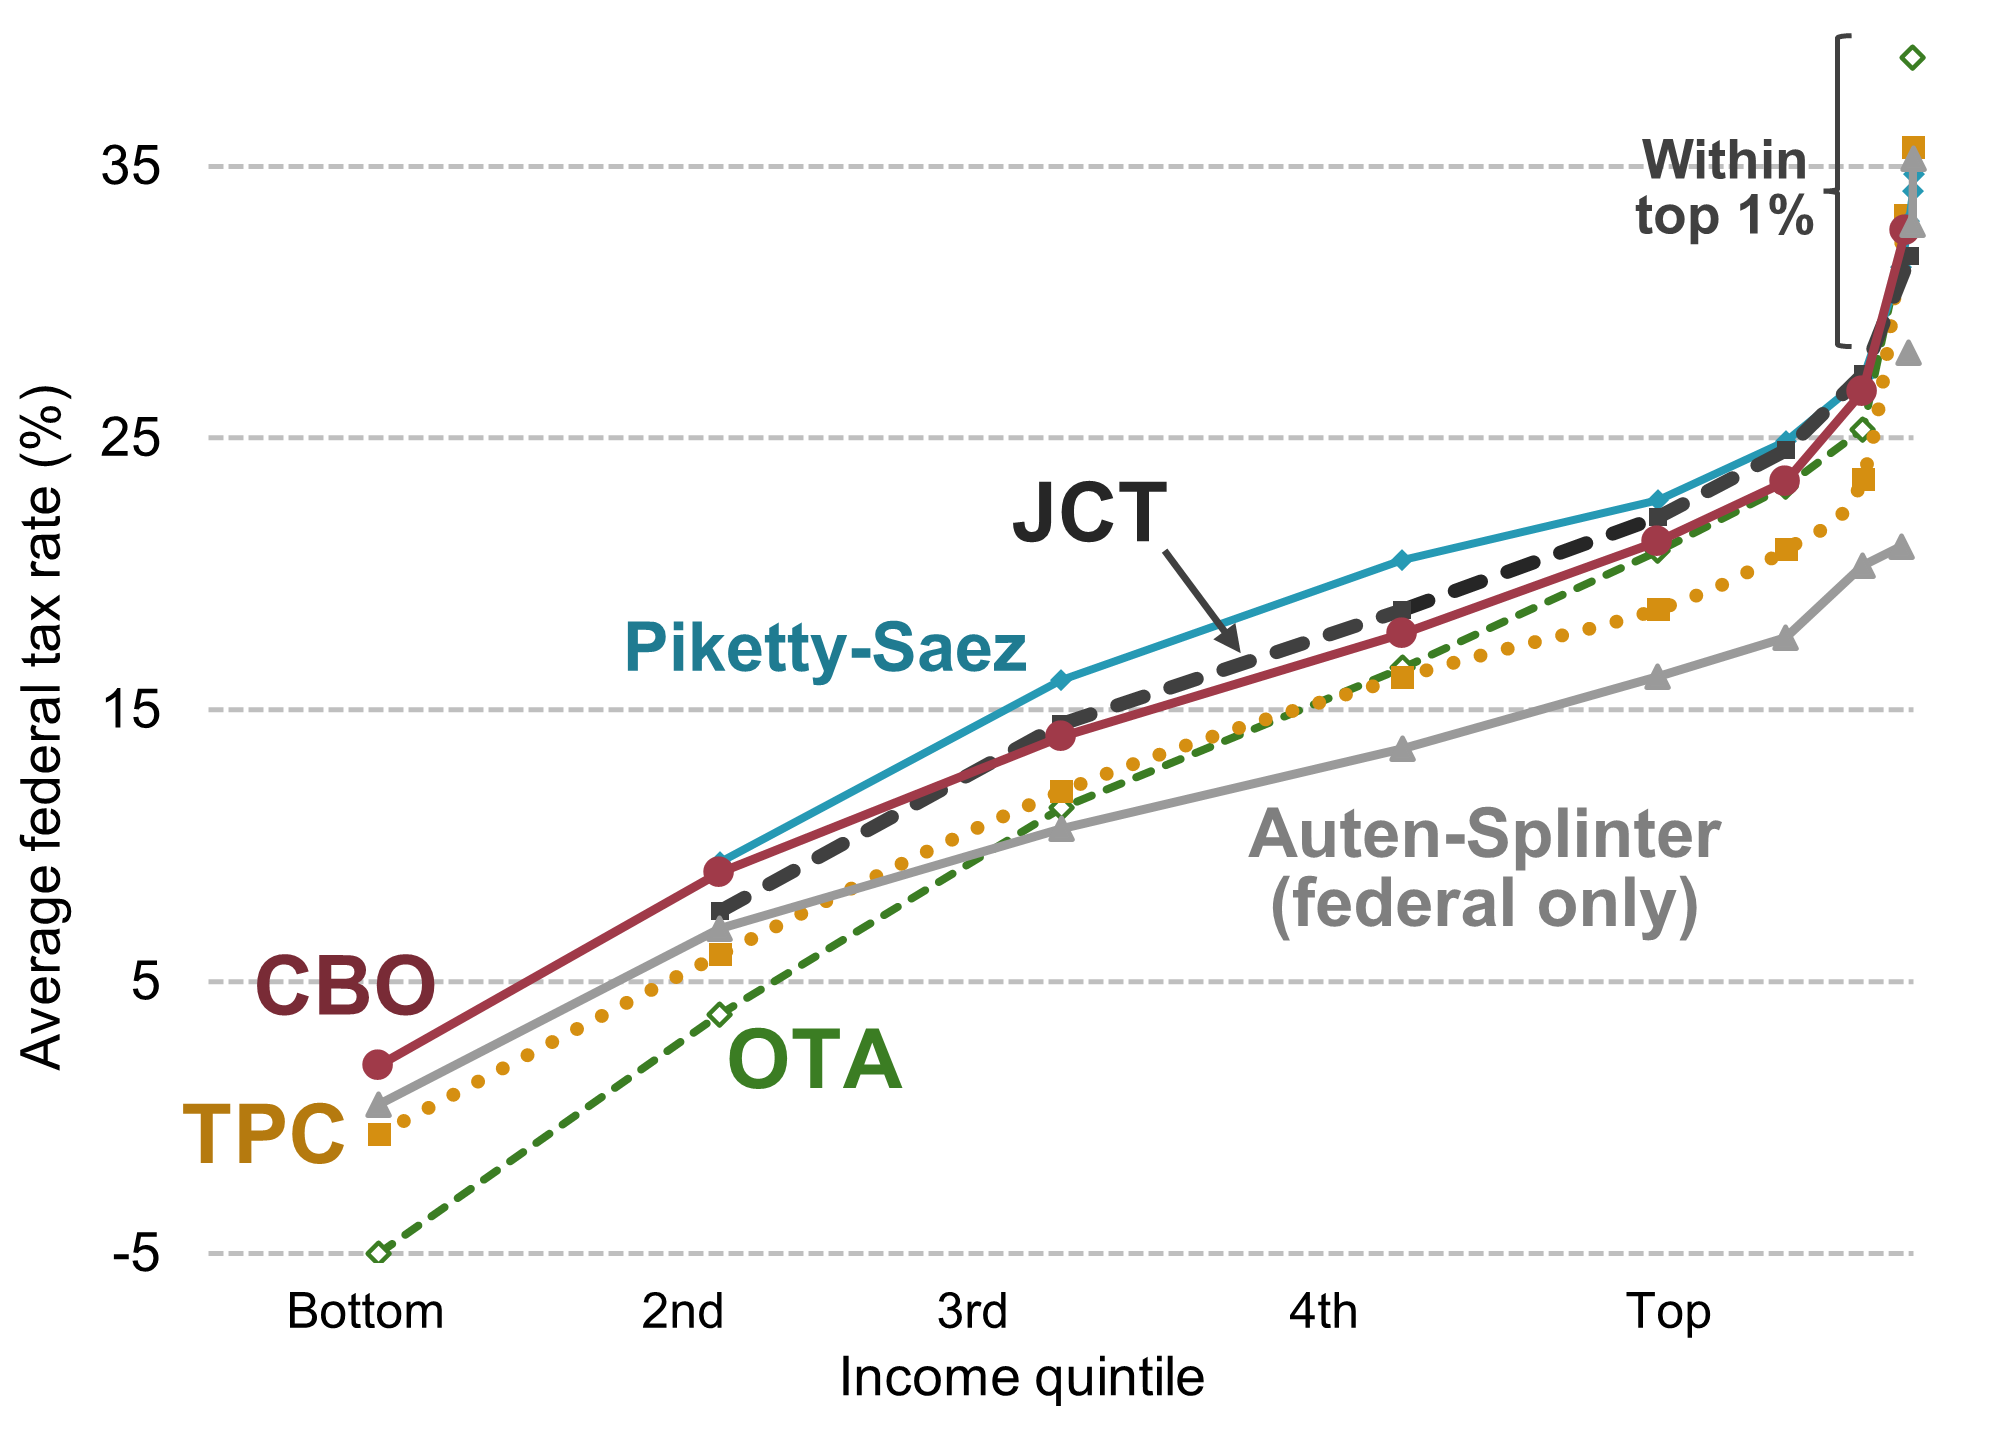
Figure 3: Effective Federal Tax Rates by Income Group, 2014 and recent years Notes: Only includes federal taxes. All income definitions include some transfers, except Piketty and Saez (2004), which results in higher tax rates. Effective tax rates are taxes divided by income, defined by Piketty-Saez as fiscal income plus payroll and corporate taxes, Auten and Splinter as pre-tax/after-transfer national income, Joint Committee on Taxation (JCT) as expanded income, Tax Policy Center (TPC) and Treasury's Office of Tax Analysis (OTA) as expanded cash income, and Congressional Budget Office (CBO) as market income plus social insurance benefits. Rates are for 2014, but OTA and JCT for 2015 and Piketty-Saez for 2004. Sources: Splinter (2020), with updated estimates for Auten and Splinter (2024 and updates).
4. SALT cap correction. Recent state and local taxes appear to be missing from the BSYZ estimates. Since 2018, the state and local tax (SALT) deduction capped taxes at $10,000 for itemized deductions, even if much more was paid. While federal tax returns provide a box to report these amounts, they are often not fully reported. Table 2 in BSYZ (2024) suggests significant top 400 state income taxes went missing since 2018. Between 2014-17 and 2018-20, there was a 22% increase in real adjusted gross income and real ordinary taxable income (AGI less capital gains and dividends)—but a 22% decrease in real state income taxes.2
II. Annual vs. Long-Run Estimates
Annual estimates can provide a distorted picture of tax burdens relative to longer-run estimates. High-income taxpayers have high levels of income volatility that causes significant movement in and out of the top 400. Splinter (2020, p. 4) wrote: "A multi-year (or even lifetime) perspective is more appropriate than annual tax burden measures for the top of the distribution due to estate taxes only paid upon death and the extreme income volatility of high-income individuals (Splinter, 2012; Auten, Gee, and Turner, 2013). For example, the IRS found more than 4,500 different taxpayers in the annual top 400 tax returns between 1992 and 2014 (www.irs.gov/pub/irssoi/14intop400.pdf)."
III. Conclusion
The U.S. tax system is progressive and tax progressivity has increased significantly since the mid-1980s (Splinter 2019a, 2020, Auten and Splinter 2024). Standard effective tax rate estimates, however, do not break out the few hundred tax returns at the top of the distribution, nor do so when ranking by wealth. Extending estimates from detailed data matching in Balkir et al. (2024), BSYZ presented estimates of effective tax rates of the top 400 tax returns ranked by wealth that suggested top rates were below overall rates. However, converting the underlying estimates into meaningful top effective tax rates introduces new challenges.
Notes
Appendix: Forbes extended families
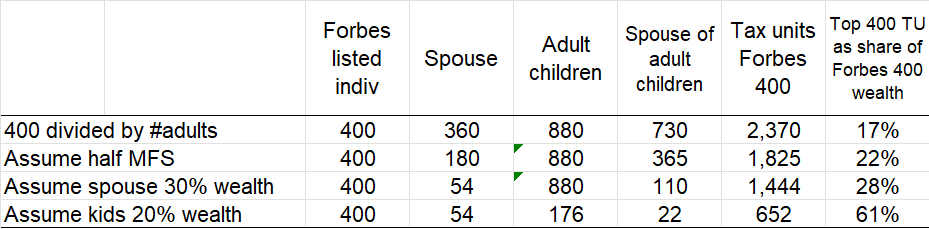
Forbes does not report individual-level or tax-return-level wealth, but "dynastic" family wealth that spans multiple generations and many tax returns. This issue has been shown to be significant. Smith, Zidar, and Zwick (2023, SZZ, p. 552) found that "adding the 400 Forbes billionaires, their spouses, and their adult children plus spouses amounts to 2,370 people who are possibly represented in Forbes." However, BSYZ appear to ignore this difference, and attribute all the extended-family wealth to only one tax unit. Therefore, reductions in the Forbes-based income denominator, and to a lesser degree the tax numerator, are needed to better match the covered tax units.
Table A1: Possible share of Forbes 400 top wealth going to top 400 tax returns
Notes: Smith, Zidar, and Zwick (2023) estimated 2,370 Forbes adults in top 400: 400 main, 360 spouses, 880 adult children, and 730 spouses of adult children. Source: Author’s calculations based on Smith, Zidar, and Zwick (2023).
References
David Splinter
August 2025 (pdf version)
These results suggest a modest decline in effective tax rates among the top few hundred returns when ranking by wealth. However, this is an unsurprising finding because the tax system targets income, not wealth. Top 400 effective tax rates exceed middle-quintile effective tax rates by about 20 percentage points and exceed bottom-quintile rates by over 35 percentage points (Figure 2). The overall progressivity of the U.S. tax system is clear.
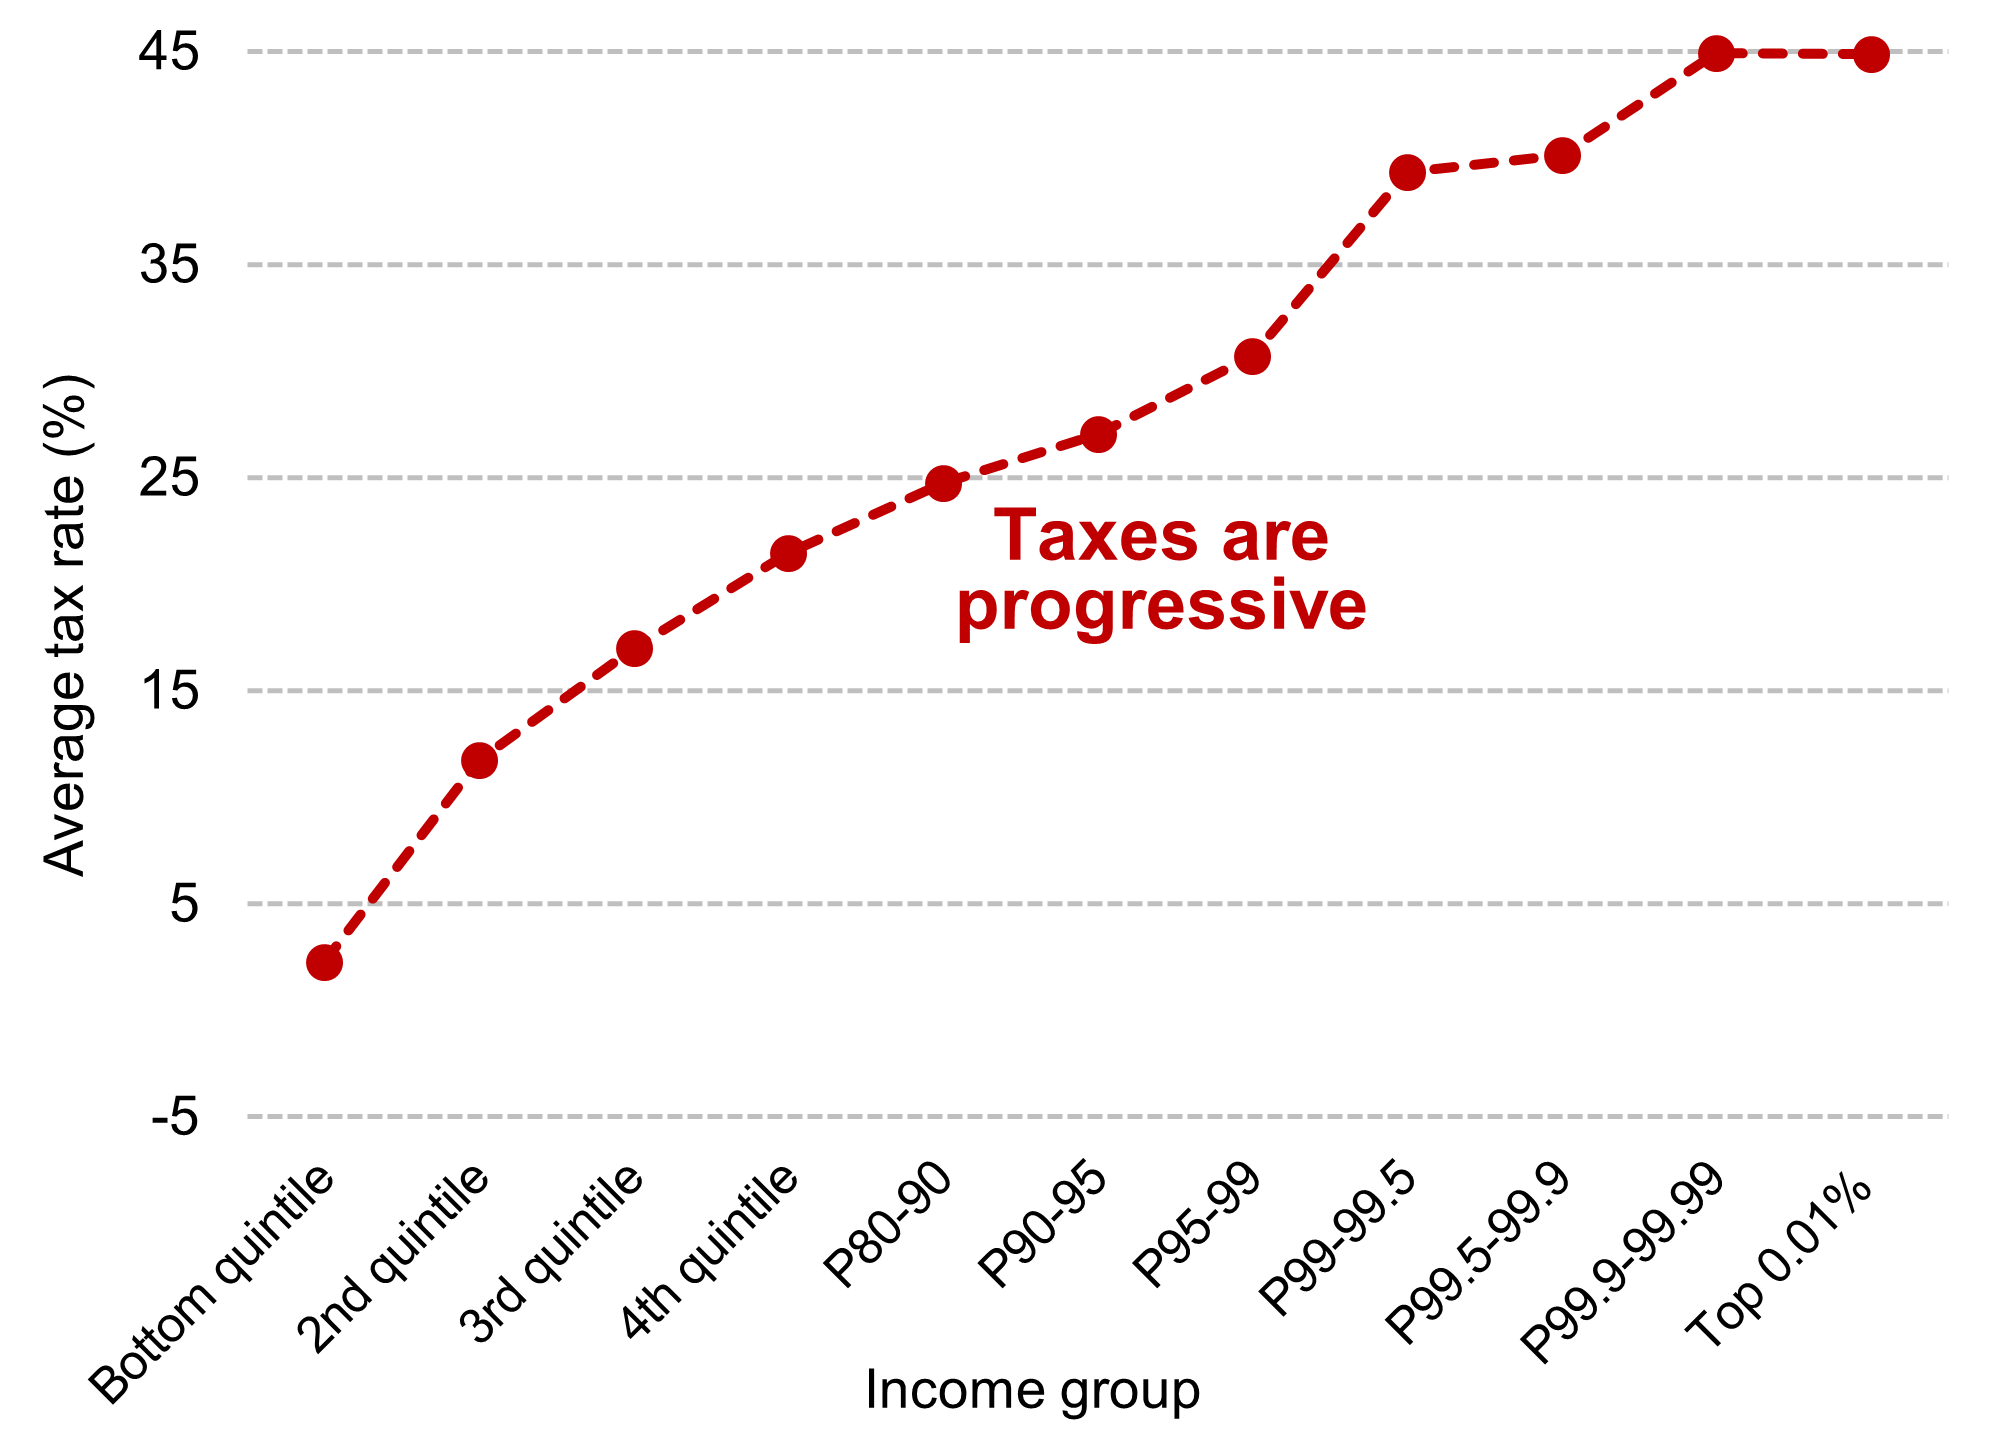
Notes: Effective tax rates are federal, state, and local taxes divided by national income plus transfers. Source: Auten and Splinter (2024 and updates).
Table 1: Effective tax rates of "top 400" tax returns, 2018-2020 averages
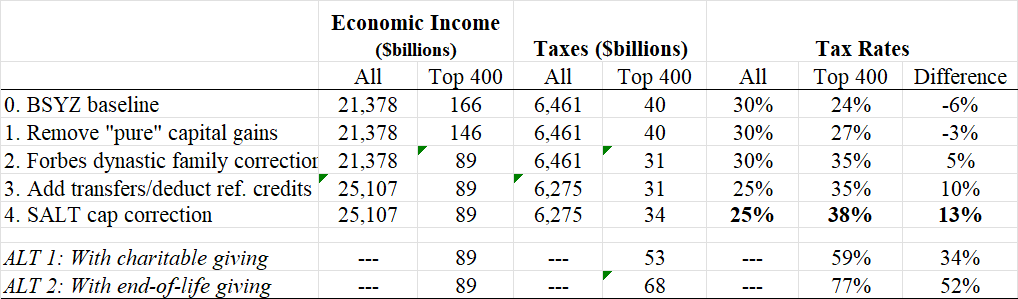
2. Forbes dynastic family correction. BSYZ noted that only 30% of Forbes wealth showed up on estate returns among the individuals who died in the sample. While some of this is from estate tax avoidance, missing wealth also results from BSYZ not correcting for Forbes dynastic families. Using estimates from Smith, Zidar, and Zwick (2023), who found the 400 Forbes list included about 2,370 adults, I adjust for this discrepancy. The baseline adjustment for dynastic family wealth being spread over more than 400 tax returns lowers top incomes and taxes, increasing the top effective tax rates by 8 percentage points. Alternative assumptions result in increases of between 4 and 13 percentage points. See the appendix for details.
3. Add transfers to income and deduct refundable credits from taxes. Standard effective tax rates include transfers in the income denominator and deduct refundable tax credits from the tax numerator (which national accounts do not label as taxes). However, the BSYZ estimates do not apply this standard approach. Adding transfers to income and deducting refundable credits from taxes lowers the overall effective tax rate by 5 percentage points.
This is not a new critique. Auten and Splinter (2024) explained the reasons for the standard approach of including transfers in the income base, e.g., Social Security benefits and unemployment benefits are taxed. Splinter (2019b, and 2020 appendix) discussed how a national-income approach like that used in BSYZ can result in relatively flat tax rates across income groups that contrast with the findings of progressivity across the many other estimates in Figure 3. Also, during a Congressional hearing in 2019, Joint Economic Committee Chairman Mike Lee said approaches like that of BSYZ, "don't count other government transfers as income when you group people. So doesn't that make them look a lot poorer and thus have higher tax rates than if you counted those benefits in that category?"1
If state income taxes increased proportionally with ordinary taxable income then they would have been 57% larger in 2018-20 ($17 billion vs. $11 billion). Adding these likely missing state income taxes increases the top 400 effective tax rate by 3 percentage points. This shows effective tax rates of the top 400 exceeding overall rates by 13 percentage points.
5. Charitable Giving. The estimates of high-wealth charitable contributions in BSYZ are large and broadly consistent with prior estimates.3 To account for annual giving, I apply their estimated top giving rate of 11.4% of economic income to the baseline top 400 economic income. The percentage-point increase here is nearly twice as large because corrected top income is about half as large as the baseline. Adding annual charitable giving increases the top 400 effective tax-and-giving rate by 21 percentage points to 59%.
High-net-worth individuals disproportionately make charitable contributions upon death. Joulfaian (2001) found that among estate returns, the highest wealth group (average wealth of $700 million in 2024 dollars) made annual contributions of about 1% relative to estate wealth but made end-of-life bequests equal to 47% of their estate wealth (mostly to foundations).4 In this paper, estimated end-of-life top 400 giving is based on this 47% estimate of very high estate wealth being bequeathed. This amount is converted to giving to a share of annual economic income using the BSYZ top 0.0002% average wealth-to-income ratio ($8,015K in wealth divided by $452K of economic income). It is then annualized by dividing by 30 years and cut in half to account for missing wealth from estate tax returns among corrected Forbes individuals. The resulting estimated top bequests as a share of annual income is then multiplied by corrected top 400 economic income. Adding estimated annual end-of-life giving increases the top 400 effective tax-and-giving rate by 14 percentage points to 73%. This estimate has significant uncertainty. It could be lower if considering more years, higher if considering bequests not captured in estate taxes, and could fluctuate up or down based on outlier giving behavior.
The BSYZ one-year wealth rankings are affected by volatility in wealth. Gomez (2023) estimated that those entering and exiting the top group account for about half of the increase in top wealth. These same forces can push down annual top tax rates. For example, someone with large undistributed economic profits might enter the sample that year, exactly when they have a low tax rate. When their economic income later declines (and average tax rates likely increase), they can be replaced by new individuals with temporarily low taxes. A longer-run picture would capture more taxes from these individuals as they realize capital gains or receive dividends related to wealth increases.
The declines in corporate and passthrough business taxes from accelerated depreciation starting in 2018 suggests the 2018-2020 period highlighted by BSYZ may have temporarily depressed top tax rates. Auten and Splinter (2025, p. 6) noted that "When the tax code begins allowing more excess depreciation, as in 2018, this shifts tax depreciation forward in time relative to economic depreciation—but these are temporary effects...Corporate excess depreciation...has already seen a sign reversal, between 2019 and 2022 these went from $94 billion to -$219 billion." Given changes in tax policy, longer-run estimates can provide a more accurate picture of top tax burdens.
Starting with the BSYZ estimates, I adjust for Forbes 400 families being on multiple tax returns, remove double-counted capital income, add missing taxes, and apply standard income definitions. The resulting top 400 effective tax rate is above the overall rate by 13 percentage points. But even after these adjustments, the corrected top 400 effective tax rate is below the tax rate of the top 0.01% (about 32K individuals) when ranked by income. This dip in top rates at the very top of the wealth distribution is expected due to the reasons noted in BSYZ—retained earnings and accelerated depreciation of business expenses—but also because the top 400 are ranked by wealth in these estimates even though taxes are overwhelmingly based on income. Moving from ranking by income to wealth breaks the link with the tax base. Moreover, because BSYZ use one-year wealth rankings, they capture rapid wealth increases that push new members into the top 400 and push down annual tax rates. A longer-run picture would capture more taxes from these individuals as they realize capital gains or receive dividends related to those wealth increases, as well as end-of-life charitable bequests that represent a significant share of their wealth.
2. There was also a 10% decrease in real federal income taxes among the top 400, consistent with the top statutory rate cuts. BSYZ Figure 2 estimates are also consistent with some state income taxes going missing since 2018. Between 2014-17 and 2018-2020, the top 0.0002% income taxes (state, local, and foreign) as a share of economic income decreasedabout 18% despite the top federal statutory rate only decreasingabout 7% [(39.6-37.0)/39.6].
3. Splinter (2020 appendix, p. 4) noted that: "In 2014, the IRS found that the top 400 tax returns had $14.5 billion in charitable deductions, or 14 percent of their taxable income. Deducting a portion of charitable contributions from income, as an ability-to-pay perspective could imply, would result in higher top average tax rates. Splinter (2018) documented the long-run increase in high-income charitable contribution rates."
4. The highest wealth group shown in public tables for recent years is $50 million and above, for which charitable contributions are about 20% of estate values. The bequest rate appears to increase dramatically for higher wealth categories within this group. Joulfaian (2001) showed the next lower wealth group only had a nend-of-life giving rate of 7% ($5.1M/$70.4M in 1997 levels), as compared to 47% ($190M/$405M) for the highest wealth group.
Using SZZ's counts of spouses and adult children for 2021, I estimate that the top 400 tax unit wealth could be about 39% lower (and taxes 21% lower) than Forbes top 400 dynastic family wealth. The baseline assumptions in Table A1 are that half of spouses file a separate return and wealth allocations for spouses are 30% and for adult children are 20%. This is broadly consistent with the SZZ estimate that their correction for dynastic families lowers top 0.001% (of adults) average wealth from $1,342 to $1,025. This 24% decrease can be seen as a lower-bound because the top 0.0002% of tax units considered by BSYZ represents a narrower group that is even more sensitive to this issue. Not only does income need to be scaled down, but so do top taxes (offsetting the overall top tax rate effect). The top tax offset, based on the share of taxes not from individual income or payroll taxes (i.e., the imputed share based on Forbes data), is about half the size of the income adjustment.
There is uncertainty regarding how to adjust Forbes dynastic families to tax units. The baseline assumptions increase the top 400 effective tax rate by 8 percentage points. As compared to the baseline 39% income adjustments, alternative adjustments of 25% or 50% result in corrected top 400 effective tax rates of 34% and 44%, that exceed the overall rate by 9 to 19 percentage points.